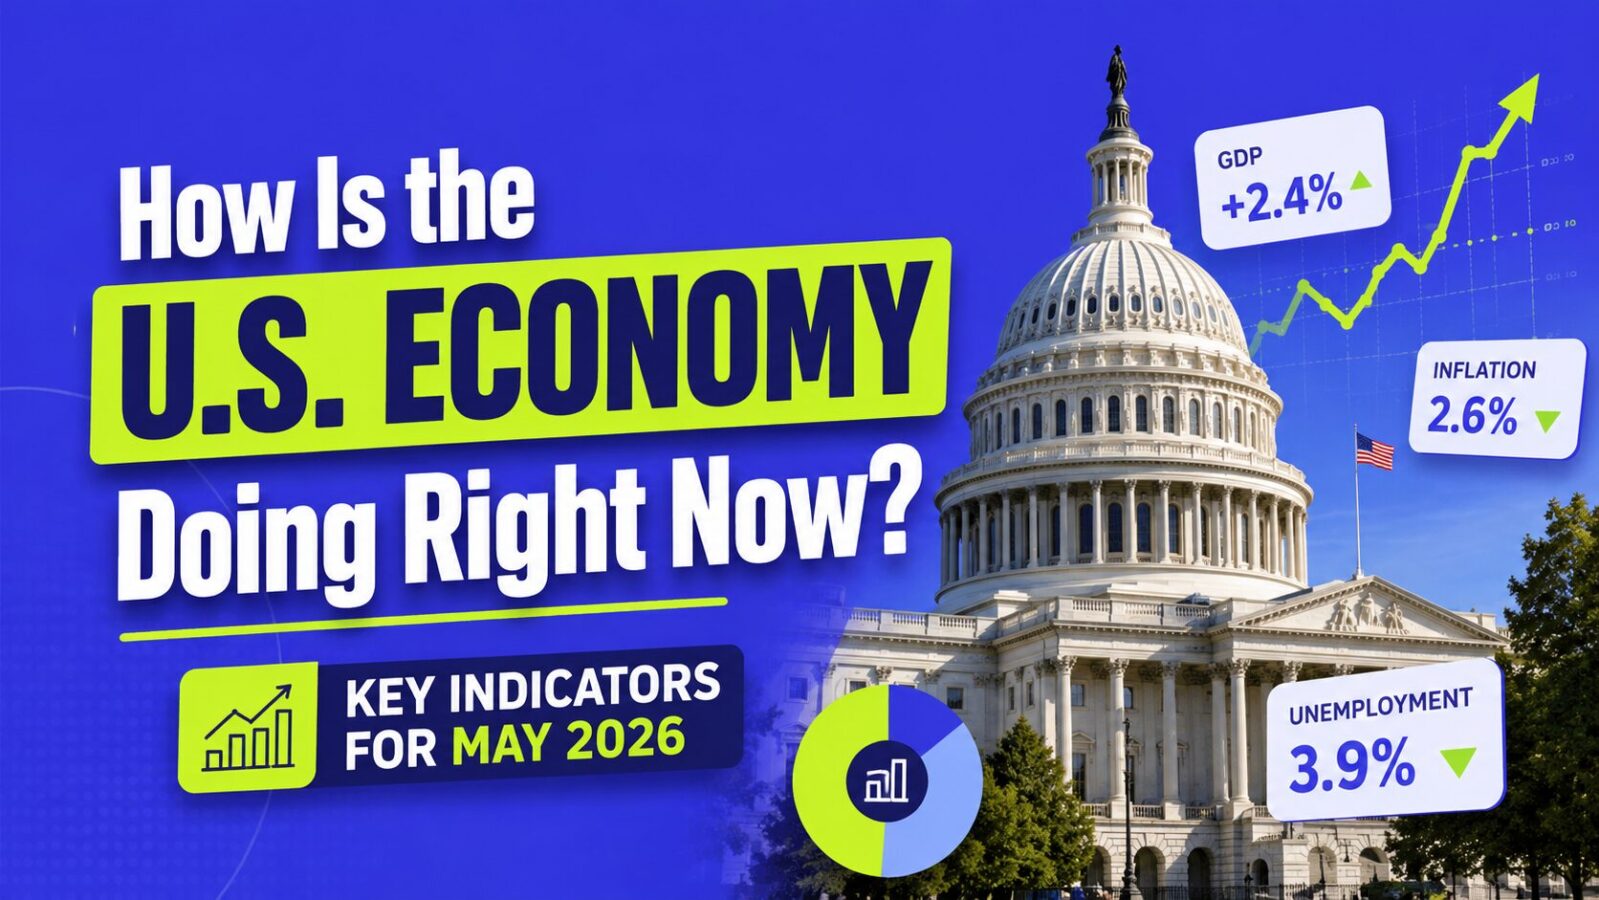
The U.S. economy in May 2026 is a study in contradictions. The stock market is at all-time highs. Unemployment is manageable at 4.3%. GDP is growing. But inflation is running at 3.8%, gas prices are up 43.6% year-over-year, and consumer confidence has fallen to its lowest level since 2022. The Iran conflict, elevated energy prices, and tariff effects are the defining forces shaping household finances right now. This page tracks every major economic indicator and updates weekly.
- The U.S. is not in recession: Q1 2026 GDP grew 1.6% and unemployment is 4.3%, but consumer confidence is near multi-year lows.
- It is a ‘two economies’ split: stocks and corporate earnings are strong while real wages are flat and gas is up sharply.
- The Fed is holding rates at 3.50-3.75%; cuts are unlikely until inflation cools.
- Priorities now: kill high-interest debt, hold cash in a 4%+ HYSA, and stay diversified.
Last updated May 29, 2026. Sources: BLS, BEA, Fed, EIA, Bankrate, CNBC.
Is the U.S. in a Recession?
No. The U.S. is not in a recession as of May 2026. GDP grew at a 1.6% annualized rate in Q1 2026, unemployment remains below 5%, and the stock market is at record highs. However, consumer confidence has fallen sharply, real wages are declining in purchasing power terms, and the Conference Board’s Consumer Confidence Index dropped to 93.1 in May, reflecting widespread concern about inflation and the economic impact of the Iran conflict.
A recession is technically defined as two consecutive quarters of negative GDP growth. Q1 2026 was positive at 1.6%. Q2 data will be available in late July. Most economists do not forecast a recession in 2026 but acknowledge the risk has risen from the energy price shock and tariff uncertainty.
GDP: Is the Economy Growing?
Q1 2026 GDP: +1.6% annualized
The U.S. economy grew at a 1.6% annualized rate in the first quarter of 2026, according to the Bureau of Economic Analysis. This is below the 2.4% average growth of 2024 but represents continued expansion. The slowdown reflects the drag from higher energy prices, tighter consumer budgets, and cautious business investment in the face of geopolitical uncertainty.
Context: GDP dropped to historic lows in Q2 2020 during the pandemic and rebounded sharply in 2021. Growth was robust through 2023-2024. The current 1.6% pace reflects a slowing but still growing economy. Q1 2025 briefly went negative as businesses front-ran tariff expectations by stockpiling imports, which inflated the import component of GDP. Q2 and Q3 2025 recovered strongly. Q4 2025 slowed again and Q1 2026 has continued at a moderate pace.
Unemployment: Is the Job Market Healthy?
April 2026 unemployment rate: 4.3%
The U.S. unemployment rate was 4.3% in April 2026, unchanged from March. The rate has held above 4% since May 2024. This is higher than the sub-4% levels of 2022-2023 but still within the range that economists consider close to full employment. Historically, unemployment below 5% is associated with a healthy labor market.
The labor market is stagnant rather than deteriorating. Hiring has slowed but mass layoffs are not occurring. Job openings have declined from their 2022 peak of over 11 million to approximately 7.5 million in early 2026. The ratio of job openings to unemployed workers has normalized from the extreme tightness of 2021-2022 but remains healthy by historical standards.
What this means for workers: Job security is generally good but wage bargaining power is lower than 2021-2022. Switching jobs to get a raise is less reliable than it was. The tight job market for tech workers specifically has eased significantly with layoffs across the sector. Healthcare, infrastructure, and defense sectors remain strong hiring markets.
Wages: Are Workers Keeping Up With Inflation?
March 2026 wage growth: 3.9%
Nominal wages grew at 3.9% year-over-year as of March 2026. With CPI at 3.8%, real wage growth (wages minus inflation) is approximately 0.1%, essentially flat. Workers are barely keeping up with inflation. This is a significant deterioration from 2023-2024 when real wages were growing by 1-2% annually.
The energy price shock has eroded real wages in a way that is invisible in the paycheck but visible at the gas station and grocery store. A worker who received a 3.9% raise is technically earning more dollars but can buy roughly the same amount of goods and services as last year. Workers without a raise are experiencing a real pay cut.
Inflation: How Fast Are Prices Rising?
April CPI: 3.8% | Core CPI: 2.8% | PCE: 3.8% | Core PCE: 3.3%
Inflation accelerated from 3.3% in March to 3.8% in April 2026, driven almost entirely by energy prices. Gasoline is up 28.4% year-over-year. Energy overall is up 17.9%. Core inflation (excluding food and energy) at 2.8% is elevated but more contained than the headline number suggests.
The Iran conflict disrupted oil flows through the Strait of Hormuz beginning in late February, sending crude oil prices surging. This is a supply-side inflation shock, unlike the demand-driven inflation of 2021-2022. Supply-side inflation is harder for the Fed to address with rate policy since the cause is geopolitical rather than excessive demand.
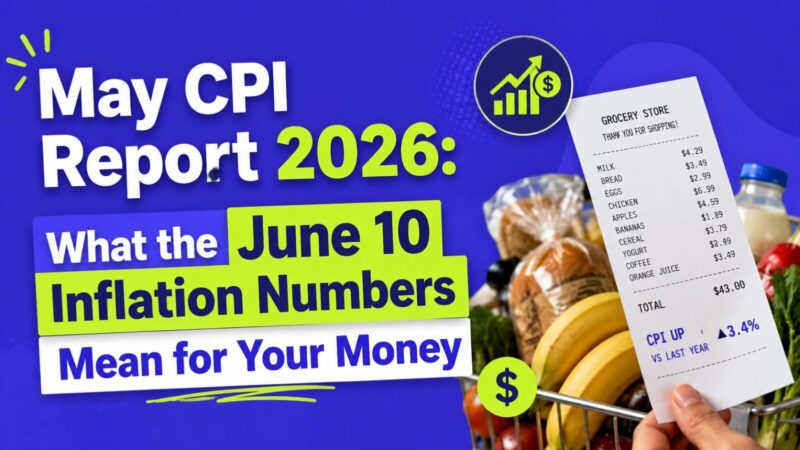
The next CPI report covering May 2026 data releases on June 10. See our full inflation rate tracker for detailed CPI, PCE, and PPI breakdowns.
Gas Prices: What Drivers Are Paying
National average: $4.48/gallon (May 25, 2026)
Gas prices are at their highest since July 2022. The national average hit $4.48/gallon on May 25, up from $2.96 on February 26 before the Iran conflict escalated. That is a 54% increase in 13 weeks. California drivers are paying an average of $6.15/gallon. The cheapest gas is in Oklahoma and Mississippi at approximately $3.94-$3.98/gallon.
There is a potential catalyst for relief: Iranian media reported in late May that U.S. and Iranian negotiators may be close to a 60-day ceasefire agreement that could gradually restore energy exports through the Strait of Hormuz. Gas futures fell on this news. If a ceasefire holds and oil flows normalize, gas prices could retrace meaningfully over the summer. Before the Iran conflict began, GasBuddy had projected the 2026 annual average at $2.97/gallon.
Interest Rates: When Will the Fed Cut?
Current federal funds rate: 3.50-3.75%
The Federal Reserve has held rates steady at 3.50-3.75% throughout 2026 after making three cuts in late 2024 and two more in late 2025. With CPI at 3.8% and core PCE at 3.3%, both above the 2% target, rate cuts at the June 17-18 FOMC meeting are not expected.
Rate cut expectations have shifted significantly since the Iran conflict escalated. At the start of 2026, markets were pricing in 3-4 cuts for the year. As of late May, expectations have shifted to potentially one cut in late 2026 or early 2027, depending on whether inflation moderates and the Iran situation stabilizes.
Higher rates for longer means: mortgage rates remain above 6.5%, credit card APRs stay near 20%+, and HYSA rates stay attractive at 4%+. For savers, the high-rate environment is a benefit. For borrowers and homebuyers, it is a constraint.
Mortgage Rates: What Homebuyers Are Paying
30-year fixed: 6.56% (May 29, 2026)
The average 30-year fixed mortgage rate is 6.56% as of May 29, 2026, according to Bankrate. The Freddie Mac weekly survey shows 6.51% as of May 21. Rates spiked after April's CPI report showed 3.8% inflation and have been volatile since, fluctuating between 6.36-6.70% over the past month.
At 6.56%, a $400,000 mortgage carries a monthly principal and interest payment of approximately $2,527. A year ago at this time, the 30-year rate was around 6.86%, so rates are actually slightly lower year-over-year despite the inflation uptick. Rates could fall meaningfully if a ceasefire agreement holds and oil prices decline, since lower energy prices would reduce inflation expectations and allow the Fed to consider cuts sooner.
The 15-year fixed rate is 5.85% (Freddie Mac, May 21). Refinancing rates run slightly higher than purchase rates: 6.73% on the 30-year refinance (Bankrate).
Stock Market: Where Indexes Stand
S&P 500: 7,564 | Dow: 50,669 | Nasdaq: 26,917 (May 28, 2026 close)
All three major U.S. stock indexes are at or near all-time highs as of late May 2026. The S&P 500 is up approximately 27.9% over the past 12 months. The Dow crossed 50,000 for the first time in February 2026 and has continued higher. The Nasdaq is being driven by AI spending and tech earnings, with Snowflake posting its best day ever on May 28 after strong guidance.
The stock market rally appears disconnected from the consumer confidence collapse and real wage stagnation. The explanation: corporate earnings have held up as companies with pricing power passed inflation through to consumers, and AI-related capital spending has driven technology sector profits. The market is also pricing in potential rate cuts later in 2026 if the Iran situation resolves and inflation falls.
Bank of America strategists warned in late May that stocks may be running out of room after the relentless rally and are preparing clients for a potential summer pullback. The S&P 500 VIX volatility index is at 16.5, indicating that options markets are not pricing in extreme near-term risk.
Consumer Confidence: How Americans Feel About the Economy
University of Michigan Sentiment: 44.8 | Conference Board: 93.1 (May 2026)
Consumer confidence has deteriorated sharply. The University of Michigan's Index of Consumer Sentiment fell to 44.8 in May, down from 49.8 in April and from over 70 in late 2024. The Conference Board's Consumer Confidence Index fell to 93.1 in May from 93.8 in April. Its Expectations Index, measuring how consumers feel about the next 6 months, is at 74.4, well below the 80-point threshold that historically signals recession concerns.
The gap between the stock market (at records) and consumer confidence (near multi-year lows) reflects a divide between the financial economy and the real economy. Investors who hold stocks and homes are seeing their wealth grow. Workers without substantial savings and investments are experiencing the inflation at the gas pump and grocery store without the offsetting wealth effect. The personal saving rate fell to 3.6% in March 2026, its lowest since 2022, suggesting consumers are drawing down savings to maintain spending in the face of higher prices.
Trade: Imports, Exports, and the Trade Deficit
March 2026 trade deficit: $60.3 billion | Exports: $320.9B | Imports: $381.2B
The U.S. trade deficit was $60.3 billion in March 2026, up 4.4% from February. Exports rose 2.0% to $320.9 billion while imports rose 2.3% to $381.2 billion. The U.S. has run a persistent trade deficit for decades. The Trump administration's tariffs have had mixed effects on the deficit, with some reduction in certain categories offset by higher import costs in others.
Higher oil import costs are directly inflating the import side of the trade balance as crude prices rise. If the Iran ceasefire holds and oil prices decline, the import bill could decrease, potentially narrowing the deficit modestly in Q2 and Q3 2026.
What This Means for Your Finances
The current economic environment creates a specific set of financial priorities:
If you have high-interest debt: Pay it down aggressively. The Fed is not cutting rates soon. Credit card APRs above 20% are likely to persist for most of 2026.
If you have savings in a traditional bank account: Move cash to a high-yield savings account earning 4%+. At 3.8% inflation, sitting in a 0.01% savings account costs real money every month.
If you are thinking about buying a home: Rates at 6.56% are historically manageable, not extreme. The bigger constraint is affordability from high home prices. If a ceasefire drives rates below 6%, that will likely trigger a wave of buying that pushes prices higher. Waiting for lower rates often results in higher prices.
If you are invested in the stock market: The S&P 500 at records with a potential summer pullback on the horizon means staying diversified and avoiding concentration in any single sector. A ceasefire would likely push energy stocks down and tech stocks up; war escalation would do the opposite.
If you receive Social Security: The 2026 COLA of 2.8% is below the current 3.8% inflation rate, meaning purchasing power is declining in real terms this year. The 2027 COLA, announced in October, will be based on Q3 2026 CPI-W data, which will reflect whatever happens to energy prices over the summer.
What to Watch Next
| Date | Report | Why It Matters |
|---|---|---|
| June 4 | May jobs report | Unemployment rate and wage growth for May |
| June 10 | May CPI report | Will inflation accelerate further or start to cool? |
| June 11 | May PPI report | Wholesale price pressures going forward |
| June 17-18 | FOMC meeting | Fed decision on interest rates |
| June 25 | May PCE report | Fed's preferred inflation measure for May |
| June 26 | Q1 GDP final estimate | Final Q1 2026 GDP revision |
Frequently Asked Questions
It depends on which measure you look at. GDP is growing at 1.6%, the stock market is at record highs, and unemployment is 4.3%. But inflation is at 3.8%, real wages are flat, consumer confidence is near multi-year lows, and gas prices are up 43% from pre-Iran conflict levels. The financial economy (stocks, corporate earnings) is performing well. The real economy for average consumers is under pressure from energy and food prices.
Most economists do not forecast a recession in 2026 but the probability has risen. The Conference Board's Expectations Index at 74.4 is in the range that historically precedes recessions, but it has not been confirmed by actual economic contraction. Q2 2026 GDP data (available late July) will be the key indicator to watch.
Gas prices could fall significantly if a U.S.-Iran ceasefire agreement restores oil flows through the Strait of Hormuz. Reports in late May 2026 suggested preliminary ceasefire discussions are underway. Before the Iran conflict, GasBuddy had forecast the 2026 annual average at $2.97/gallon. Whether prices return to that level depends entirely on the geopolitical situation.
Mortgage rates are unlikely to fall meaningfully until the Fed begins cutting the federal funds rate, which is unlikely before late 2026 given 3.8% inflation. A faster-than-expected decline in inflation (particularly if oil prices fall) could accelerate the timeline. The 30-year fixed rate at 6.56% is already slightly lower than a year ago at 6.86%, suggesting the worst of the rate environment may be past.
Finance Pulse does not provide investment advice. What the data shows: the S&P 500 is up 27.9% over the past year and at record highs, which means valuations are elevated by historical standards. Bank of America strategists warned of a potential summer pullback. For long-term investors with a 10-plus year horizon, timing the market is less important than being in the market. For shorter-term investors, the risk-reward at current levels is less favorable than it was 12 months ago.
Sources: Bureau of Labor Statistics (CPI, unemployment, PPI, wage growth); Bureau of Economic Analysis (GDP, PCE, trade data); Federal Reserve (fed funds rate); EIA/FRED (gas prices); Bankrate, Freddie Mac (mortgage rates); CNBC (stock market data); University of Michigan, Conference Board (consumer confidence); NerdWallet senior economist commentary. Page updated May 29, 2026. Next update: June 4, 2026 after May jobs report.