There is no shortage of budgeting apps out there. Finance Pulse has covered the best budgeting apps available right now. But sometimes the most powerful budgeting tool is the one you build yourself.
A spreadsheet is one way to run the framework in our how to budget guide.
A custom budget spreadsheet gives you total control. No subscription fees. No syncing issues. No app deciding how to categorize your Costco trip. Just you, your numbers, and a clear picture of where every dollar goes.
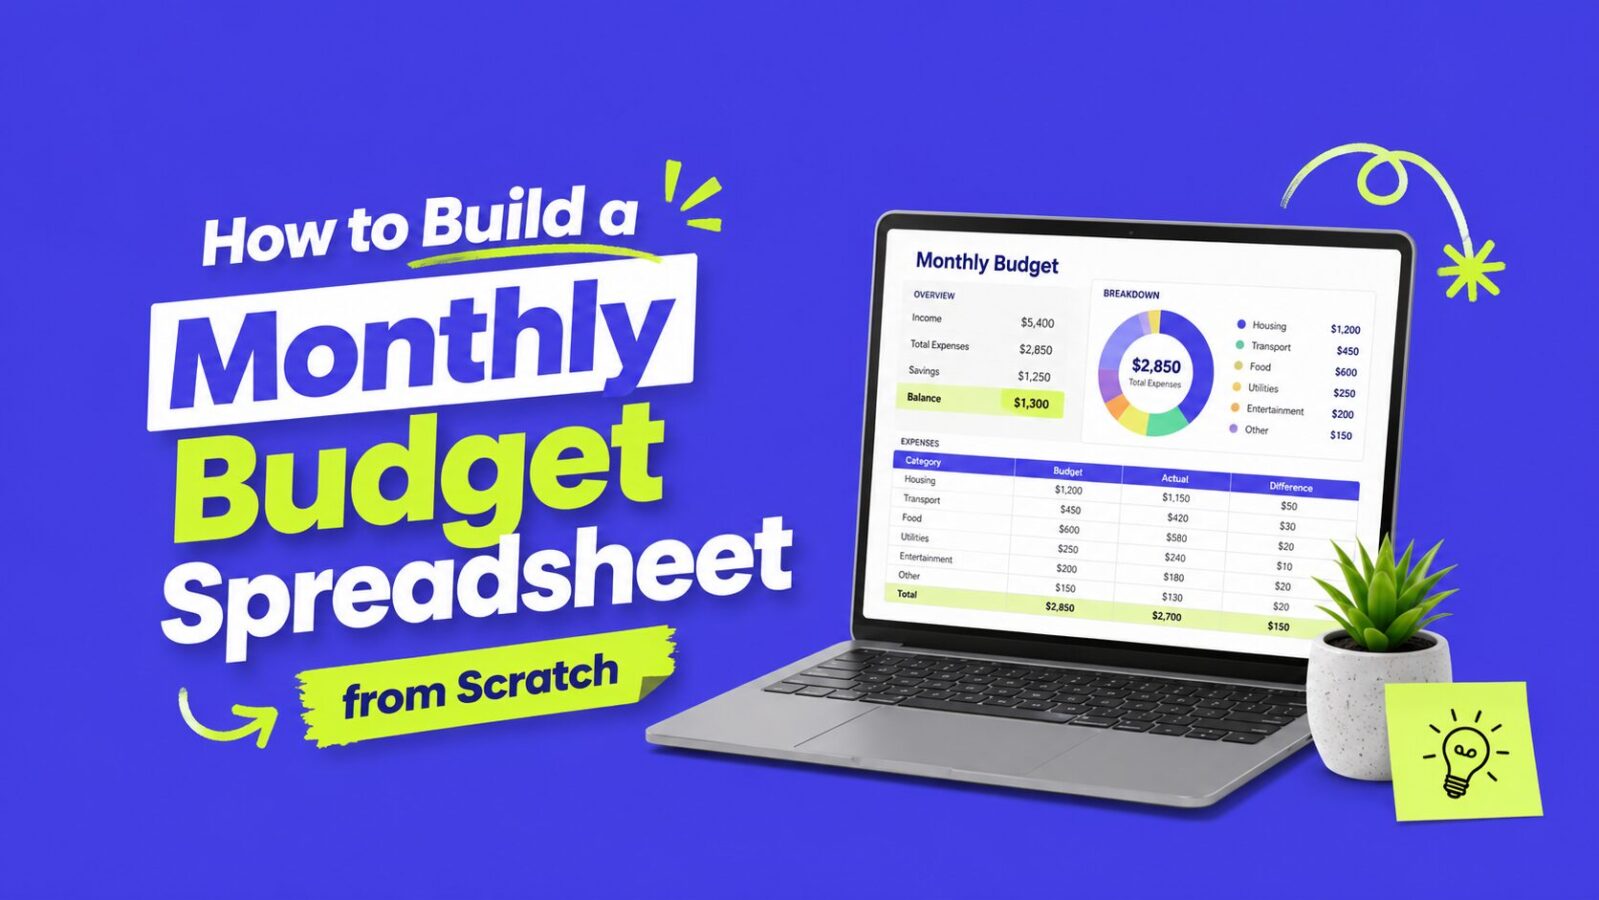
Whether you are a spreadsheet beginner or someone who just wants a fresh system, this guide walks you through building a monthly budget spreadsheet from scratch: what categories to include, which formulas to use, how to set it up for ongoing tracking, and how to avoid the mistakes that make most DIY budgets fail within a month.
Prefer to skip the build? If you want a ready-to-use template, grab the free Monthly Budget Spreadsheet, pre-built with the structure described in this guide. Or read on to build your own from scratch.
- A custom spreadsheet is free, fully customizable, and private, no app fees or syncing issues.
- Use four tabs: Dashboard, Income, Expenses, and Yearly Overview.
- The two formulas that do the heavy lifting are SUMIFS (totals by category) and a Budget vs. Actual difference column.
- Track your savings rate, the single most important number on your dashboard.
- Setup takes about 30 to 45 minutes; upkeep is just a few minutes a day.
Why build your own budget spreadsheet?
Full customization. Pre-made templates and apps are designed for the average person. Maybe you have irregular income from freelancing. Maybe you split expenses with a partner in a specific way. A custom spreadsheet adapts to your life, not the other way around.
No recurring costs. Budgeting apps like YNAB charge monthly fees. Google Sheets is completely free. Microsoft Excel comes with most Microsoft 365 subscriptions. LibreOffice Calc is free and open-source.
Better understanding of your money. There is something about manually entering numbers that forces you to actually think about spending. When an app auto-categorizes everything, it is easy to glance at a pie chart and move on. When you are typing “$47.83, DoorDash” into a cell, you feel that number differently.
Privacy. Budget spreadsheets stored locally do not share your financial data with third-party servers.
What you will need
- Google Sheets (free with a Google account), Microsoft Excel, or LibreOffice Calc
- About 30 to 45 minutes to set everything up
- Your last 2 to 3 months of bank and credit card statements
- A rough idea of your monthly income
This guide uses Google Sheets for the examples, but every formula and concept works in Excel and LibreOffice Calc with minimal adjustments. If you would rather start from an official template, the Consumer Financial Protection Bureau offers free budgeting worksheets.
Step 1: Set up your spreadsheet structure
Open a new spreadsheet and create the following tabs along the bottom:
- Dashboard: Your at-a-glance monthly summary
- Income: All money coming in
- Expenses: Every dollar going out
- Yearly Overview: Month-by-month tracking for the full year
Start with the Expenses tab since that is where most of the work happens.
The Expenses tab layout
Set up these column headers in Row 1:
| A | B | C | D | E |
|---|---|---|---|---|
| Date | Description | Category | Amount | Notes |
- Date: When the transaction happened
- Description: What you bought or paid for (e.g., “Electric bill,” “Target groceries”)
- Category: The budget category it falls under (more on this below)
- Amount: How much you spent
- Notes: Optional, useful for flagging unusual expenses or shared costs
Format the Date column as dates and the Amount column as currency. In Google Sheets, select the column, go to Format > Number > Date or Currency.
The Income tab layout
| A | B | C | D |
|---|---|---|---|
| Date | Source | Amount | Notes |
Sources might include your primary salary, a side hustle, freelance income, interest earned, cash gifts, tax refunds, or any other money coming in.
Step 2: Choose your budget categories
You need enough categories to see meaningful patterns, but not so many that tracking becomes a chore.
Essential expense categories
- Housing (rent or mortgage payment)
- Utilities (electric, gas, water, trash, internet)
- Groceries
- Transportation (car payment, gas, public transit, insurance, maintenance)
- Insurance (health, dental, vision, renters/homeowners, if not deducted from paycheck)
- Debt Payments (student loans, personal loans, minimum credit card payments)
- Phone (cell phone bill)
- Medical/Healthcare (copays, prescriptions, therapy)
- Childcare (if applicable)
Discretionary expense categories
- Dining Out/Takeout
- Entertainment (streaming services, movies, concerts, hobbies)
- Shopping (clothing, electronics, home goods)
- Personal Care (haircuts, gym membership, skincare)
- Subscriptions (apps, magazines, memberships)
- Travel/Vacations
- Gifts
Financial goal categories
- Emergency Fund (if still building)
- Retirement Savings (beyond employer match. See the 401(k) guide)
- Extra Debt Payments (above minimums. See debt payoff strategies)
- Short-Term Savings (car fund, vacation fund, home down payment), a great use case for sinking funds
- Investing (brokerage contributions. See the investing for beginners guide)
Setting up a category dropdown
To keep categories consistent (and make data analysis easier), create a dropdown list in your Category column.
In Google Sheets:
- Create a list of all your categories in a spare column on a hidden sheet or at the bottom of your Expenses tab
- Select the Category column (Column C)
- Go to Data > Data Validation
- Set Criteria to “List from a range” and point it to your category list
- Check “Show dropdown list in cell”
Now when you enter an expense, you pick from a dropdown instead of typing. This prevents typos and keeps everything clean for formulas later.
Step 3: Build your Dashboard
The Dashboard tab is your monthly command center.
Section 1: Income summary
In your Dashboard tab starting at cell A1:
A1: MONTHLY BUDGET DASHBOARD
A3: Month: B3: [Enter the current month, e.g., “April 2026”]
A5: INCOME A6: Total Income: B6: [Formula below]
The formula for Total Income in cell B6:
=SUMPRODUCT((MONTH(Income!A:A)=MONTH(B3))*(YEAR(Income!A:A)=YEAR(B3))*Income!C:C)
This sums all income entries from the Income tab where the date matches the month and year entered in B3. A simpler approach if you clear the Income tab each month:
=SUM(Income!C2:C100)
Section 2: Expense summary by category
Starting at row 8, list every category with a SUMIFS formula:
A8: EXPENSES BY CATEGORY A9: Housing B9: =SUMIFS(Expenses!D:D, Expenses!C:C, A9) A10: Utilities B10: =SUMIFS(Expenses!D:D, Expenses!C:C, A10) A11: Groceries B11: =SUMIFS(Expenses!D:D, Expenses!C:C, A11)
Continue this pattern for every category. The SUMIFS formula adds up all amounts in the Expenses tab where the category matches.
Section 3: Budget vs. actual
This is where your spreadsheet becomes a real budgeting tool. Add a “Budgeted” column next to your actuals:
A8: EXPENSES BY CATEGORY B8: Budgeted C8: Actual D8: Difference A9: Housing B9: 1500 C9: =SUMIFS(Expenses!D:D, Expenses!C:C, A9) D9: =B9-C9
The Difference column (D) shows whether you are over or under budget. A positive number means under budget (good). A negative number means overspent.
Pro tip: Use conditional formatting to color the Difference column: one shade for positive, another for negative. In Google Sheets: select the cells, go to Format > Conditional formatting, and set rules for “greater than 0” and “less than 0” with the colors you prefer.
Section 4: The bottom line
Total Income: =B6 Total Budgeted: =SUM(B9:B30) [adjust range to cover all categories] Total Actual Spent: =SUM(C9:C30) Remaining: =B6-SUM(C9:C30) Savings Rate: =(B6-SUM(C9:C30))/B6
Format the Savings Rate as a percentage. This single number tells you what percentage of your income you kept this month. It is one of the most important metrics in personal finance.
Step 4: Add essential formulas
Running total of monthly spending
In your Expenses tab, add a column F with the header “Running Total” and this formula in F2:
=SUMIFS(D$2:D2, C$2:C2, C2)
Drag this down. It gives you a running total per category as you add expenses throughout the month.
Average daily spending
On your Dashboard:
=SUM(Expenses!D:D)/DAY(TODAY())
Multiply by the number of days in the month to project your total monthly spending:
=SUM(Expenses!D:D)/DAY(TODAY())*DAY(EOMONTH(TODAY(),0))
Percentage of budget used
Add this next to each category:
=IF(B9=0, 0, C9/B9)
Format as a percentage. If you have used 85% of your grocery budget by the 15th of the month, you know to slow down.
Year-to-date spending by category
=SUMIFS(Expenses!D:D, Expenses!C:C, “Dining Out”)
If you are tracking all months in one Expenses tab, this shows cumulative spending in any category across the entire year.
Step 5: Set up the Yearly Overview tab
This tab gives you the big picture. Set it up as a grid:
| Jan | Feb | Mar | … | Dec | Total | |
|---|---|---|---|---|---|---|
| Total Income | ||||||
| Housing | ||||||
| Utilities | ||||||
| Groceries | ||||||
| … | ||||||
| Total Expenses | ||||||
| Net (Income – Expenses) | ||||||
| Savings Rate |
At the end of each month, transfer your Dashboard totals to this overview. The Yearly Overview lets you spot trends: Is grocery spending creeping up? Did utility bills spike in summer? This big-picture view is something most budgeting apps do not do well.
Step 6: Apply the 50/30/20 framework (optional)
If you follow the 50/30/20 budget rule, your spreadsheet can track those percentages automatically.
Add a section to your Dashboard:
Needs (50%): Target: =B6*0.5 Actual: [SUM of all essential categories] Status: =Target – Actual
Wants (30%): Target: =B6*0.3 Actual: [SUM of all discretionary categories] Status: =Target – Actual
Savings & Debt (20%): Target: =B6*0.2 Actual: [SUM of all savings/debt categories] Status: =Target – Actual
For the zero-based budgeting approach, set up your spreadsheet so every dollar of income is assigned to a category. Your “Remaining” cell on the Dashboard should always equal $0.
Step 7: Make it sustainable
Enter expenses daily (or every other day)
Do not let a week go by. The longer you wait, the harder it is to remember transactions and the more likely you are to abandon the whole thing. Set a daily reminder: “Update budget: 2 minutes.”
Keep it simple
If your spreadsheet is so complicated that updating it feels like filing taxes, you will stop using it. Start with the basics and add complexity only when you need it.
Do a weekly check-in
Every Sunday, spend 5 minutes reviewing your Dashboard. Are you on track? Any categories looking tight? Any adjustments needed? This weekly habit catches problems early.
Do a monthly review
At month’s end, review your full spending. Transfer data to the Yearly Overview. Adjust next month’s budget based on what you learned.
Share it with your partner
If you share finances with a partner, share the spreadsheet. Google Sheets makes this easy. Both of you can edit the same document in real time. Having both partners involved dramatically improves budgeting success rates. Read our couples money guide for the full framework.
Common mistakes to avoid
Forgetting irregular expenses. Quarterly insurance payments, annual subscriptions, car registration, holiday gifts. These wreck budgets because people forget to plan for them. Use sinking funds: divide annual costs by 12 and save that amount monthly.
Being too restrictive. If you budget $0 for dining out, you are setting yourself up to fail. Look at your past 3 months of spending and set budgets that represent a reasonable improvement, not a complete lifestyle overhaul.
Not tracking cash spending. Cash transactions are the black hole of budgeting. Create a “Cash” category or get receipts and log them the same day.
Overcomplicating formulas. If a formula takes 10 minutes to write and you are not sure how it works, simplify it. A basic SUM is better than a complex SUMPRODUCT that breaks when you accidentally add a blank row.
Giving up after one bad month. One month of overspending does not mean budgeting does not work. It means you have data to learn from. Adjust and keep going.
Advanced tips for spreadsheet power users
Pivot Tables for spending analysis. Select all your Expenses data and insert a Pivot Table. Set Category as rows, Month as columns, and Amount as values (sum). Instantly see spending patterns across categories and months.
Charts and graphs. Add a pie chart showing expense distribution by category. Add a line chart showing monthly spending trends.
Automated bank imports. Most major banks let you download transactions as CSV files. Import these into your spreadsheet and manually categorize them. This is much faster than typing every transaction by hand.
Conditional formatting alerts. Set up rules that highlight cells when a category exceeds its budget, when you have spent more than 80% of a category budget, or when your savings rate exceeds your target.
Frequently asked questions
Both work equally well, and every formula in this guide runs in either one. Google Sheets is free and makes real-time sharing with a partner effortless. Excel offers slightly more advanced features and works offline. Pick whichever you already use.
Enter expenses daily or every other day, it takes about two minutes and keeps the numbers accurate. Add a 5-minute weekly check-in and a longer monthly review. Waiting a full week or more is the most common reason DIY budgets get abandoned.
Enough to see meaningful patterns but few enough that tracking is not a chore, usually 12 to 18 total across essentials, discretionary spending, and financial goals. Start broad and split a category only when you actually need more detail.
Use a sinking fund: take each annual cost (insurance, car registration, holidays), divide by 12, and budget that amount as a monthly line item. The money accumulates so the bill is covered when it arrives. For variable paychecks, see our irregular income guide.
It depends on your style. A spreadsheet is free, fully customizable, and private, but requires manual entry. An app automates categorization and bank syncing for a monthly fee. If you value control and awareness, build a spreadsheet; if you value convenience, see our best budgeting apps guide.
The bottom line
Building a monthly budget spreadsheet from scratch takes about 30 to 45 minutes of upfront work. After that, maintaining it takes just a few minutes a day.
Start simple. Use the structure and formulas from this guide. Track your spending for one full month before making any dramatic changes to your habits. Let the data tell you where your money is actually going, and then make informed decisions about where you want it to go instead.
Ready to start?
- Want a head start? Download the free Monthly Budget Spreadsheet, pre-built with all the categories and structure from this guide.
- Paid biweekly or have irregular income? Use the Paycheck Planner instead. It has a calendar view that matches each expense to the paycheck it comes from.
- Prefer an app over a spreadsheet? Read our best budgeting apps guide to find the right tool for your situation.